TT Electronics takes pride in solving technology challenges for a sustainable world, providing solutions that are cleaner, smarter and healthier, which help our customers reduce their environmental impacts. At the same time, we seek to optimise our operations reducing our impact on the environment and have put in place several key reporting metrics and objectives to govern our sustainability credentials.
Our goal of becoming carbon neutral by 2035 has our team focused on understand our global carbon footprint. Global carbon reporting is a complex subject, occupying time and resource in gathering multiple data sets. The materiality impact, appropriate carbon reporting methodologies and country greenhouse gas conversion were all important factors in the gathering of data and required significant technical expertise to secure and validate.
Like many organisations, TT needed a better method to track and certify its greenhouse gas (GHG) emissions. Karen White Global VP HSE, Richard Budden QHSE Manager Sheffield and I began documenting the requirements for the tool including the inputs and desired outputs. Given the priority and importance of sustainability to the organisation, and knowing the data was required for our Annual Reports we quickly began work on the sustainability tool. The following is intended to assist other organisations in using Salesforce as a sustainability reporting tool.
Key Considerations for the project planning phase
Before you begin, carefully consider the scale and scope of the project. In TT’s case, the following questions proved to be helpful as we built our sustainability platform:
What do you want to report on, and how do you want the reports to look?
When designing an object we often overlook this step, which results in redesigns of the data structure causing delays in your development schedule. Our first design pass of the tool was based on the Excel spreadsheets that had been used in the past to collect the data. However, after trying to build charts and dashboards with the excel data structure, we quickly realized we had limited the capabilities of the tool. The structure we chose in the end utilized common value fields which allowed for the presentation of our GHG emissions based on many common grouping fields.
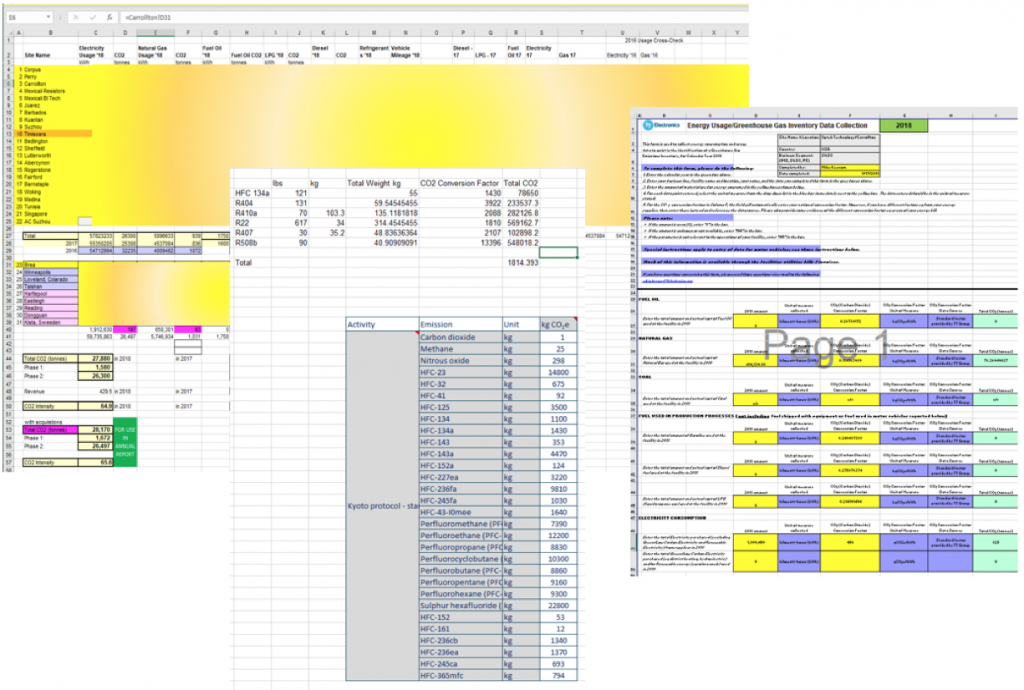
It is critical in your design to understand which GHG emissions are considered most significant and define an appropriate methodology for data collection that aligns to The GHG Protocol Corporate Accounting and Reporting Standard for your company (this is an area where you must consult your EHS team, they are an invaluable resource). Below is a view of some spreadsheets which this tool replaced. As you will see later in the document the spreadsheets were replaced by a single 7 field form with all calculations being done within salesforce.
What type of data will you be tracking and collecting?
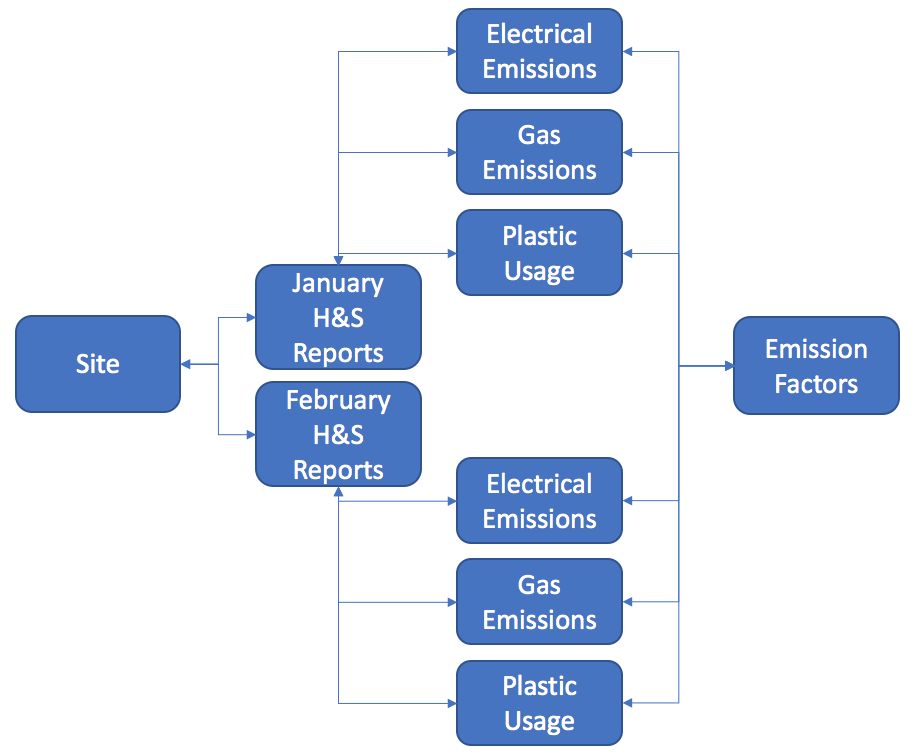
This is a another important step in the design, and a very important time to collaborate with your EHS team to ensure you are collecting the data required to satisfy your legal reporting needs. Consideration must be given to the different types of data you will be collecting in our case the data came in many different measurements and had to be collected on a site-by-site basis so we could identify areas for organization improvements. We had to think about the users who will be responsible for collecting and validating the data and how it will be best visualised. Below is a diagram representing the relationships between the objects.
How should you design and build the system?
We are a global company, so our Org design has been structured to include a Site Object which we reference on multiple objects using Lookup functions. This allows us the to have a one-to-many relationship and provides limited rollup functionality. In this case we built a Monthly Health and Safety Report object that captures both our Health and Safety data as well as our Energy Waste and CO2 (EWCO2) Emissions. It also allows us to follow the “enter data once” methodology in our design. By having a parent object, we are able to reference our emission factors and currency conversion tool using a lookup relationship and formulas. Again, one of our key goals is to reduce data entry for our users and to improve data integrity by reducing the opportunity for errors.
Emissions are a simple calculation based on a CASE formula which looks up the emission factor from the CO2 Emission Factors object and multiplies it by the resource usage. The difficulty in this design was the multiple measurements which needed to be accounted for depending on the resource used, such as kWh or Tonnes of waste. To avoid using the wrong measurement system, we took advantage of Dynamic Pages restricting the measurement field to the appropriate measurement for the resource using the Visibility controls available on custom objects. An image of the dynamic page design is below.
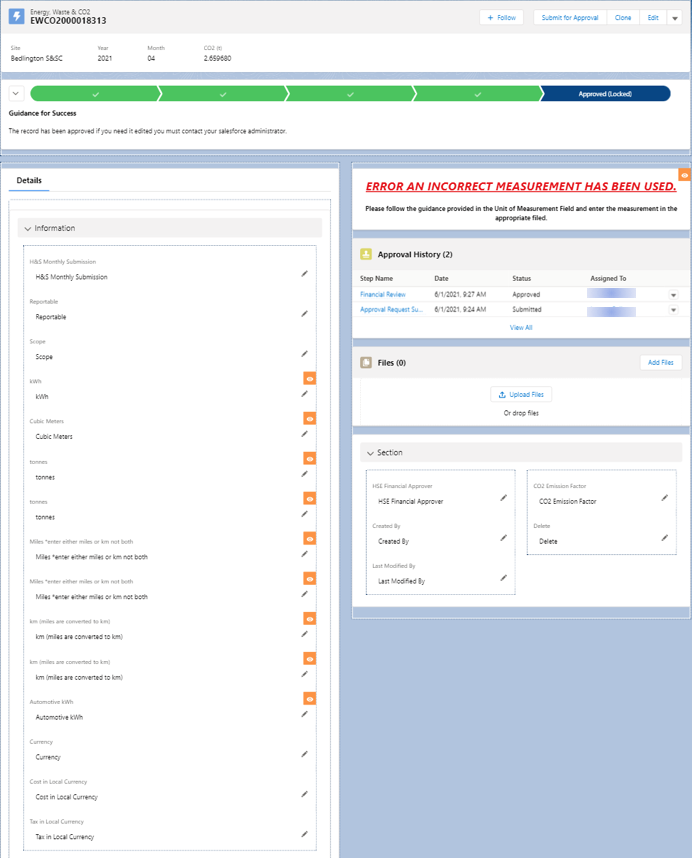
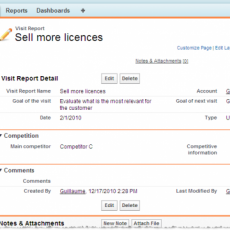
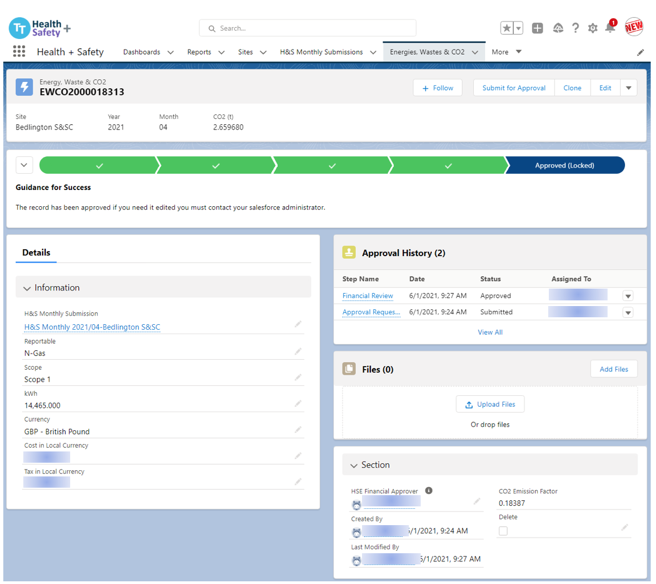
The result was a simple seven field form for the user to complete with a complex set of relationships on the back end. The goal was to present to the user only the fields they needed to complete. In this case it was a picklist of different reportables, the usage amount, and the cost of the reportable on the invoice. As the design progressed, we found additional requirements like needing to keep a copy of the usage bill with the record and the ability to approve and lock the record for annual reporting purposes. With the introduction of the Files related list and an Approval Process we were soon collecting and auditing data for our business leaders and stakeholders that met the requirements of the TCFD standard. Below is an image of the form from the end users view.
Advice on solving complex issues?
Whilst designing and building the system we had to overcome some significant technical hurdles, including:
1. Measurement variation between invoicing and emissions.
When designing your tool, it’s important to understand how invoices are calculated and supplied to different facilities so that you can accommodate some form of conversion tool to provide consistent reporting measurements across your sites.
Currently there is no international standard for utility and waste measurements on your suppliers invoice. We found our sites were receiving there waste measurements using multiple different measurement systems and they varied by plant (tons, cubic meters and cubic yard). In the case of emission factors, waste which generates CO2 emissions is converted based on tonnage. In this case we were not able to build the standard conversion into Salesforce as it varies from region to region regarding CO2 emissions and waste. Instead, we provided a central conversion tool that our sites could use to convert their measurements prior to entry in Salesforce. This remains a priority for our second stage development plan to help simplify the process further.
We also found conversions between m2 and ft2 as well as mile vs kilometers were conversions we could build into our tools so these calculations are done in the background using standard formula fields and in some cases a flow to write the data where required.
2. Reporting on years with historical data trending
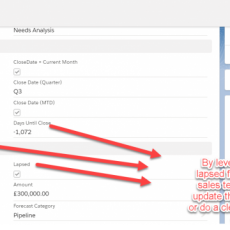
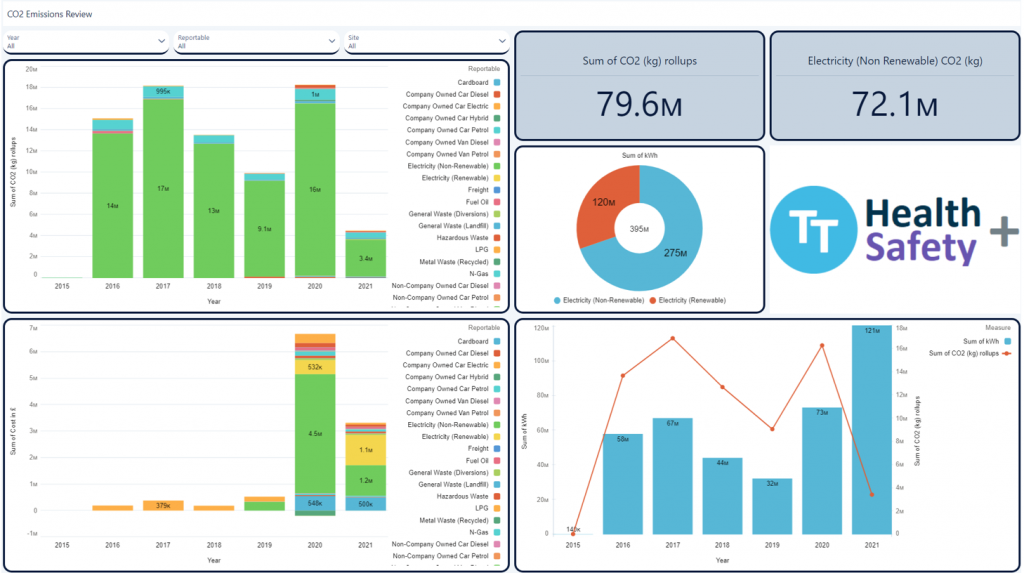
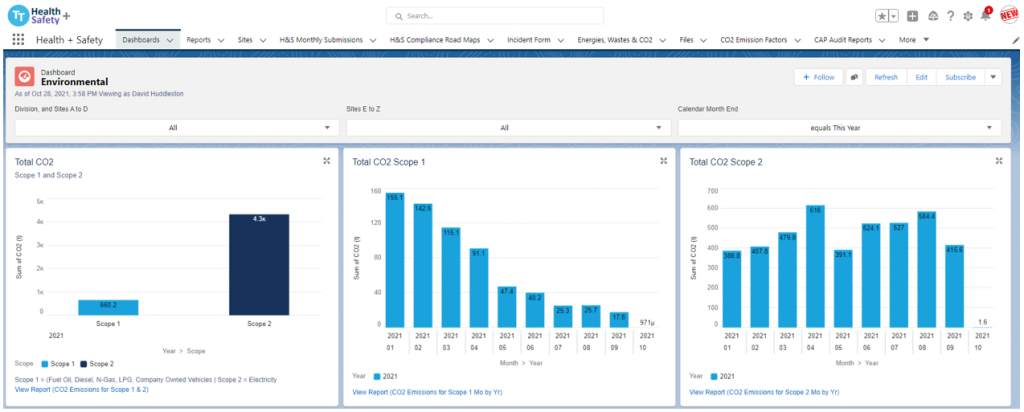
As part of our reporting processes, we often need to report by site and regions on a monthly and annual basis. This can easily be managed through tools like Tableau CRM and Einstein Analytics, but such resources are not always available to every organization, which is where salesforce standard reports and dashboards can provide a great alternative. Adding the year and month fields to your monthly H&S report allows you to gather this data and associate it to the EWCO2 record allowing for month-on-month as well as year-on-year rollup without adding additional fields to every EWCO2 record. Below are some snapshots of the dashboards we have created using both Analytics and Standard dashboards.
3. Currency issues
Another common issue you may face is in tying outcomes to a revenue value. This is easily manageable if you are working in a single currency environment, but this was not the case at TT. With facilities in the Americas, United Kingdom, Europe, and Asia, we had reports being managed in several different local currencies. So, how do we manage conversion to a common currency and maintain the currency conversion history? We know Salesforce has the potential to manage currencies, however, that doesn’t help with custom objects when you need to maintain the conversion rates for prior years. Our team had run into this issue before, so we didn’t have to work hard for a solution. In this case we created a custom object for currency conversion and titled this ‘Currency Year’ with each currency having its own field on the record. Then it was just a matter of collecting the local currency name, using a CASE formula on the EWCO2 object to lookup the conversion on the Currency Year record and using that to calculate your converted value. We now have a currency conversion that is locked in and usable on any object in salesforce.
4. Licence costs of Salesforce?
You do not need a full CRM license if your users don’t require access to Opportunities, Cases, or other sales related objects. This is a great opportunity to take advantage of Salesforce Platform licenses, they are a fraction of the cost and give you the power of custom objects. Saving your company thousands of dollars per year in licensing costs. In addition, many of your users may already have licenses, so this may be a cost neutral decision for your team. In TT’s case our site HSE professionals and finance team already had licences for data entry, and we were able to keep our costs minimal. This cost compared to an off-the-shelf dedicated sustainability tool (approximately $80K per year) justified the development time and resources.
The additional benefits of a system that is accurate, auditable with real time data visibility allows organizations to set reduction targets. This data has allowed TT to set future reduction goals and strategies to target our GHG emissions, because we now have a clear picture of our environmental impact and what resources have the greatest effect on our emissions.
5. Why not Sustainability Cloud?
Well at the time when we began developing our solution Sustainability Cloud was not available. Currently our internal sustainability tool provides us a few important features not currently available with the purchased solution. One key feature that helps us maintain data integrity is the use of Dynamic Pages which is not available yet for Standard Objects in salesforce. If I could add two things to Sustainability Cloud, it would be Dynamic Pages and Salesforce maintaining the global emission factors in their tool. This could be maintained by Salesforce it is not user defined, it defined by the regional governments and in many cases, it is difficult to locate this information for your regional plants.
In summary, here are the key takeaways which are helpful to consider before you start tracking sustainability efforts in Salesforce.
1. Carefully consider exactly what your company is required to collect and what they want to collect to be good corporate citizens. Then decide how you can gather the data to present in a fashion that supports these requirements.
2. Understand what data you are collecting, its measurements and identify the common fields that you can use to report your findings, such as a single field which contains your CO2 emissions.
3. Develop a data collection plan and take advantage of Dynamic Pages. This will help you present a simple form to your users. Dynamic pages improve user adoption, reduces errors and reduces training time for your team.
As admins and Architects, we spend most of our days focusing time and effort on sales solutions. We debug, train, design, refresh and rebuild the system to meet the need of our customers. Building a sustainability cloud was very rewarding and a nice break from the regular business applications. It also demonstrates the power of Salesforce and how creative minds can solve complex issues when you have the right tools and team for the job.
As always you can reach out on questions and feel free to post your comments below.
Please subscribe
Subscribe to our mailing list and get tips to maximize salesforce to your email inbox.
I am honored to have your subscription. Stay tuned for tips to maximize your salesforce investment
Something went wrong.